Persistence graphical tools user manual
Definition
|
|
|
||||||
|
Numpy |
|
These graphical tools comes on top of persistence results and allows the user to build easily barcode and persistence diagram. |
| Persistence graphical tools user manual | Persistence graphical tools reference manual |
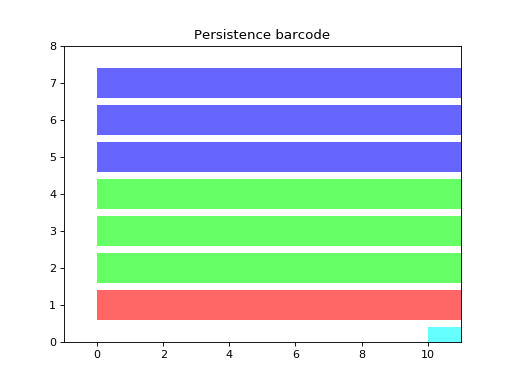
Show persistence as a barcode
This function can display the persistence result as a barcode:
import gudhi

perseus_file = gudhi.__root_source_dir__ + '/data/bitmap/3d_torus.txt'
periodic_cc = gudhi.PeriodicCubicalComplex(perseus_file=perseus_file)
diag = periodic_cc.persistence()
print("diag = ", diag)
plt = gudhi.plot_persistence_barcode(diag)
plt.show()
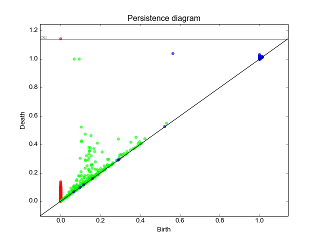
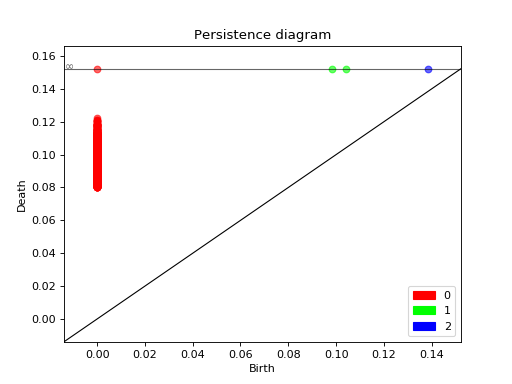
Show persistence as a diagram
This function can display the persistence result as a diagram:
import gudhi

# rips_on_tore3D_1307.pers obtained from write_persistence_diagram method
persistence_file=gudhi.__root_source_dir__ + \
    '/data/persistence_diagram/rips_on_tore3D_1307.pers'
plt = gudhi.plot_persistence_diagram(persistence_file=persistence_file,
    legend=True)
plt.show()
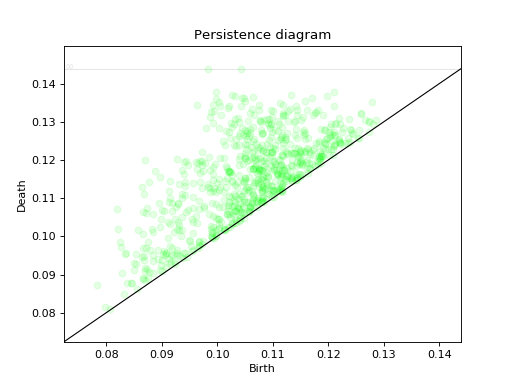
If you want more information on a specific dimension, for instance:
import gudhi

persistence_file=gudhi.__root_source_dir__ + \
    '/data/persistence_diagram/rips_on_tore3D_1307.pers'
diag = \
    gudhi.read_persistence_intervals_grouped_by_dimension(persistence_file=\
        persistence_file)
dim = 1
# Display all points with some transparency
plt = gudhi.plot_persistence_diagram([(dim,interval) for interval in diag[dim]],
    max_plots=0, alpha=0.1)
plt.show()