Rips complex user manual
Definition
|
|
|
| Rips complex user manual | Rips complex reference manual |
Rips complex is a one skeleton graph that allows to construct a simplicial complex from it. The input can be a point cloud with a given distance function, or a distance matrix.
The filtration value of each edge is computed from a user-given distance function, or directly from the distance matrix.
All edges that have a filtration value strictly greater than a given threshold value are not inserted into the complex.
When creating a simplicial complex from this one skeleton graph, Rips inserts the one skeleton graph into the data structure, and then expands the simplicial complex when required.
Vertex name correspond to the index of the point in the given range (aka. the point cloud).
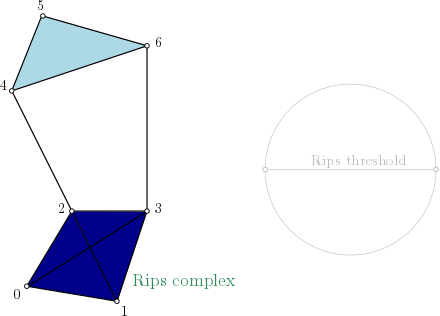
Rips-complex one skeleton graph representation
On this example, as edges (4,5), (4,6) and (5,6) are in the complex, simplex (4,5,6) is added with the filtration value set with \(max(filtration(4,5), filtration(4,6), filtration(5,6))\). And so on for simplex (0,1,2,3).
If the Rips_complex interfaces are not detailed enough for your need, please refer to rips_persistence_step_by_step.cpp example, where the graph construction over the Simplex_tree is more detailed.
Point cloud
Example from a point cloud
This example builds the one skeleton graph from the given points, and max_edge_length value. Then it creates a Simplex_tree with it.
Finally, it is asked to display information about the simplicial complex.
import gudhi
rips_complex = gudhi.RipsComplex(points=[[1, 1], [7, 0], [4, 6], [9, 6], [0, 14], [2, 19], [9, 17]],
    max_edge_length=12.0)

simplex_tree = rips_complex.create_simplex_tree(max_dimension=1)
result_str = 'Rips complex is of dimension ' + repr(simplex_tree.dimension()) + ' - ' + \
    repr(simplex_tree.num_simplices()) + ' simplices - ' + \
    repr(simplex_tree.num_vertices()) + ' vertices.'
print(result_str)
fmt = '%s -> %.2f'
for filtered_value in simplex_tree.get_filtration():
    print(fmt % tuple(filtered_value))
When launching (Rips maximal distance between 2 points is 12.0, is expanded until dimension 1 - one skeleton graph in other words), the output is:
Rips complex is of dimension 1 - 18 simplices - 7 vertices.
[0] -> 0.00
[1] -> 0.00
[2] -> 0.00
[3] -> 0.00
[4] -> 0.00
[5] -> 0.00
[6] -> 0.00
[2, 3] -> 5.00
[4, 5] -> 5.39
[0, 2] -> 5.83
[0, 1] -> 6.08
[1, 3] -> 6.32
[1, 2] -> 6.71
[5, 6] -> 7.28
[2, 4] -> 8.94
[0, 3] -> 9.43
[4, 6] -> 9.49
[3, 6] -> 11.00
Example from OFF file
This example builds the Rips_complex from the given points in an OFF file, and max_edge_length value. Then it creates a Simplex_tree with it.
Finally, it is asked to display information about the Rips complex.
import gudhi
point_cloud = gudhi.read_off(off_file=gudhi.__root_source_dir__ + '/data/points/alphacomplexdoc.off')
rips_complex = gudhi.RipsComplex(points=point_cloud, max_edge_length=12.0)
simplex_tree = rips_complex.create_simplex_tree(max_dimension=1)
result_str = 'Rips complex is of dimension ' + repr(simplex_tree.dimension()) + ' - ' + \
    repr(simplex_tree.num_simplices()) + ' simplices - ' + \
    repr(simplex_tree.num_vertices()) + ' vertices.'
print(result_str)
fmt = '%s -> %.2f'
for filtered_value in simplex_tree.get_filtration():
    print(fmt % tuple(filtered_value))
the program output is:
Rips complex is of dimension 1 - 18 simplices - 7 vertices.
[0] -> 0.00
[1] -> 0.00
[2] -> 0.00
[3] -> 0.00
[4] -> 0.00
[5] -> 0.00
[6] -> 0.00
[2, 3] -> 5.00
[4, 5] -> 5.39
[0, 2] -> 5.83
[0, 1] -> 6.08
[1, 3] -> 6.32
[1, 2] -> 6.71
[5, 6] -> 7.28
[2, 4] -> 8.94
[0, 3] -> 9.43
[4, 6] -> 9.49
[3, 6] -> 11.00
Distance matrix
Example from a distance matrix
This example builds the one skeleton graph from the given distance matrix, and max_edge_length value. Then it creates a Simplex_tree with it.
Finally, it is asked to display information about the simplicial complex.
import gudhi
rips_complex = gudhi.RipsComplex(distance_matrix=[[],
                                                  [6.0827625303],
                                                  [5.8309518948, 6.7082039325],
                                                  [9.4339811321, 6.3245553203, 5],
                                                  [13.0384048104, 15.6524758425, 8.94427191, 12.0415945788],
                                                  [18.0277563773, 19.6468827044, 13.152946438, 14.7648230602, 5.3851648071],
                                                  [17.88854382, 17.1172427686, 12.0830459736, 11, 9.4868329805, 7.2801098893]],
                                 max_edge_length=12.0)

simplex_tree = rips_complex.create_simplex_tree(max_dimension=1)
result_str = 'Rips complex is of dimension ' + repr(simplex_tree.dimension()) + ' - ' + \
    repr(simplex_tree.num_simplices()) + ' simplices - ' + \
    repr(simplex_tree.num_vertices()) + ' vertices.'
print(result_str)
fmt = '%s -> %.2f'
for filtered_value in simplex_tree.get_filtration():
    print(fmt % tuple(filtered_value))
When launching (Rips maximal distance between 2 points is 12.0, is expanded until dimension 1 - one skeleton graph in other words), the output is:
Rips complex is of dimension 1 - 18 simplices - 7 vertices.
[0] -> 0.00
[1] -> 0.00
[2] -> 0.00
[3] -> 0.00
[4] -> 0.00
[5] -> 0.00
[6] -> 0.00
[2, 3] -> 5.00
[4, 5] -> 5.39
[0, 2] -> 5.83
[0, 1] -> 6.08
[1, 3] -> 6.32
[1, 2] -> 6.71
[5, 6] -> 7.28
[2, 4] -> 8.94
[0, 3] -> 9.43
[4, 6] -> 9.49
[3, 6] -> 11.00
Example from csv file
This example builds the Rips_complex from the given distance matrix in a csv file, and max_edge_length value. Then it creates a Simplex_tree with it.
Finally, it is asked to display information about the Rips complex.
import gudhi
distance_matrix = gudhi.read_lower_triangular_matrix_from_csv_file(csv_file=gudhi.__root_source_dir__ + \
    '/data/distance_matrix/full_square_distance_matrix.csv')
rips_complex = gudhi.RipsComplex(distance_matrix=distance_matrix, max_edge_length=12.0)
simplex_tree = rips_complex.create_simplex_tree(max_dimension=1)
result_str = 'Rips complex is of dimension ' + repr(simplex_tree.dimension()) + ' - ' + \
    repr(simplex_tree.num_simplices()) + ' simplices - ' + \
    repr(simplex_tree.num_vertices()) + ' vertices.'
print(result_str)
fmt = '%s -> %.2f'
for filtered_value in simplex_tree.get_filtration():
    print(fmt % tuple(filtered_value))
the program output is:
Rips complex is of dimension 1 - 18 simplices - 7 vertices.
[0] -> 0.00
[1] -> 0.00
[2] -> 0.00
[3] -> 0.00
[4] -> 0.00
[5] -> 0.00
[6] -> 0.00
[2, 3] -> 5.00
[4, 5] -> 5.39
[0, 2] -> 5.83
[0, 1] -> 6.08
[1, 3] -> 6.32
[1, 2] -> 6.71
[5, 6] -> 7.28
[2, 4] -> 8.94
[0, 3] -> 9.43
[4, 6] -> 9.49
[3, 6] -> 11.00
Correlation matrix
Example from a correlation matrix
Analogously to the case of distance matrix, Rips complexes can be also constructed based on correlation matrix. Given a correlation matrix M, comportment-wise 1-M is a distance matrix. This example builds the one skeleton graph from the given corelation matrix and threshold value. Then it creates a Simplex_tree with it.
Finally, it is asked to display information about the simplicial complex.
import gudhi
import numpy as np

# User defined correlation matrix is:
# |1     0.06    0.23    0.01    0.89|
# |0.06  1       0.74    0.01    0.61|
# |0.23  0.74    1       0.72    0.03|
# |0.01  0.01    0.72    1       0.7 |
# |0.89  0.61    0.03    0.7     1   |
correlation_matrix=np.array([[1., 0.06, 0.23, 0.01, 0.89],
                            [0.06, 1., 0.74, 0.01, 0.61],
                            [0.23, 0.74, 1., 0.72, 0.03],
                            [0.01, 0.01, 0.72, 1., 0.7],
                            [0.89, 0.61, 0.03, 0.7, 1.]], float)

distance_matrix = np.ones((correlation_matrix.shape),float) - correlation_matrix
rips_complex = gudhi.RipsComplex(distance_matrix=distance_matrix, max_edge_length=1.0)

simplex_tree = rips_complex.create_simplex_tree(max_dimension=1)
result_str = 'Rips complex is of dimension ' + repr(simplex_tree.dimension()) + ' - ' + \
    repr(simplex_tree.num_simplices()) + ' simplices - ' + \
    repr(simplex_tree.num_vertices()) + ' vertices.'
print(result_str)
fmt = '%s -> %.2f'
for filtered_value in simplex_tree.get_filtration():
    print(fmt % tuple(filtered_value))
When launching (Rips maximal distance between 2 points is 12.0, is expanded until dimension 1 - one skeleton graph in other words), the output is:
Rips complex is of dimension 1 - 15 simplices - 5 vertices.
[0] -> 0.00
[1] -> 0.00
[2] -> 0.00
[3] -> 0.00
[4] -> 0.00
[0, 4] -> 0.11
[1, 2] -> 0.26
[2, 3] -> 0.28
[3, 4] -> 0.30
[1, 4] -> 0.39
[0, 2] -> 0.77
[0, 1] -> 0.94
[2, 4] -> 0.97
[0, 3] -> 0.99
[1, 3] -> 0.99
Note
As persistence diagrams points will be under the diagonal, bottleneck distance and persistence graphical tool will not work properly, this is a known issue.