Persistence graphical tools user manual
Definition
|
These graphical tools comes on top of persistence results and allows the user to build easily persistence barcode, diagram or density. |
|
||||||||
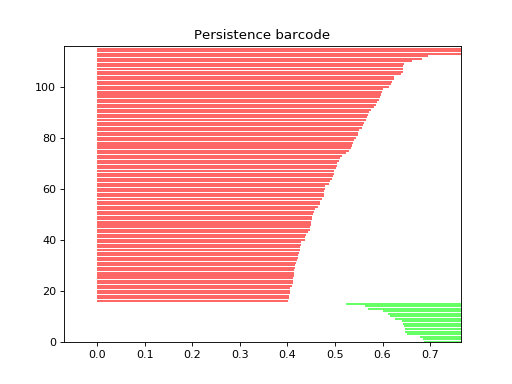
Show persistence as a barcode
Note
this function requires matplotlib and numpy to be available
This function can display the persistence result as a barcode:
import gudhi

off_file = gudhi.__root_source_dir__ + '/data/points/tore3D_300.off'
point_cloud = gudhi.read_off(off_file=off_file)

rips_complex = gudhi.RipsComplex(points=point_cloud, max_edge_length=0.7)
simplex_tree = rips_complex.create_simplex_tree(max_dimension=3)
diag = simplex_tree.persistence(min_persistence=0.4)

plot = gudhi.plot_persistence_barcode(diag)
plot.show()
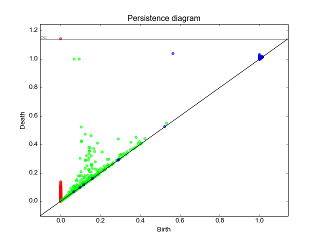
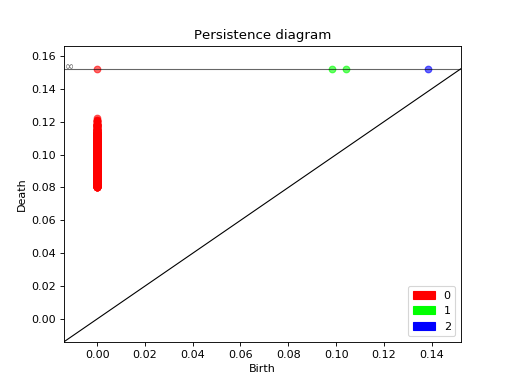
Show persistence as a diagram
Note
this function requires matplotlib and numpy to be available
This function can display the persistence result as a diagram:
import gudhi

# rips_on_tore3D_1307.pers obtained from write_persistence_diagram method
persistence_file=gudhi.__root_source_dir__ + \
    '/data/persistence_diagram/rips_on_tore3D_1307.pers'
plt = gudhi.plot_persistence_diagram(persistence_file=persistence_file,
    legend=True)
plt.show()
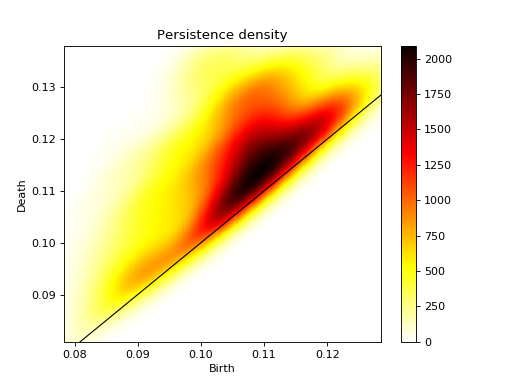
Persistence density
Note
this function requires matplotlib, numpy and scipy to be available
If you want more information on a specific dimension, for instance:
import gudhi

# rips_on_tore3D_1307.pers obtained from write_persistence_diagram method
persistence_file=gudhi.__root_source_dir__ + \
    '/data/persistence_diagram/rips_on_tore3D_1307.pers'
plt = gudhi.plot_persistence_density(persistence_file=persistence_file,
    max_intervals=0, dimension=1, legend=True)
plt.show()