Persistence graphical tools user manual
Definition
|
|
|
||||||
|
Numpy |
|
These graphical tools comes on top of persistence results and allows the user to build easily barcode and persistence diagram. |
| Persistence graphical tools user manual | Persistence graphical tools reference manual |
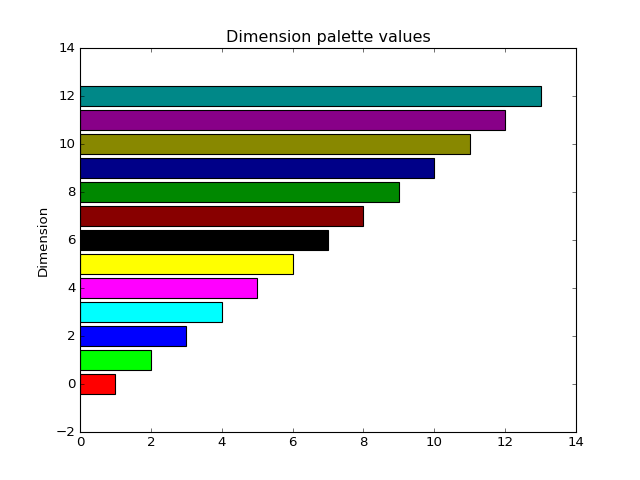
Show palette values
This function is useful to show the color palette values of dimension:
import gudhi
plt = gudhi.show_palette_values(alpha=1.0)
plt.show()
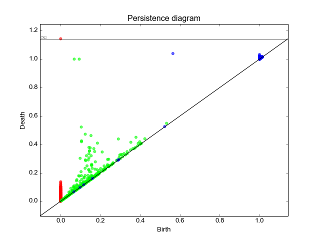
Show persistence as a barcode
This function can display the persistence result as a barcode:
import gudhi

periodic_cc = gudhi.PeriodicCubicalComplex(perseus_file=gudhi.__root_source_dir__ + \
    '/data/bitmap/3d_torus.txt')
diag = periodic_cc.persistence()
plt = gudhi.plot_persistence_barcode(diag)
plt.show()

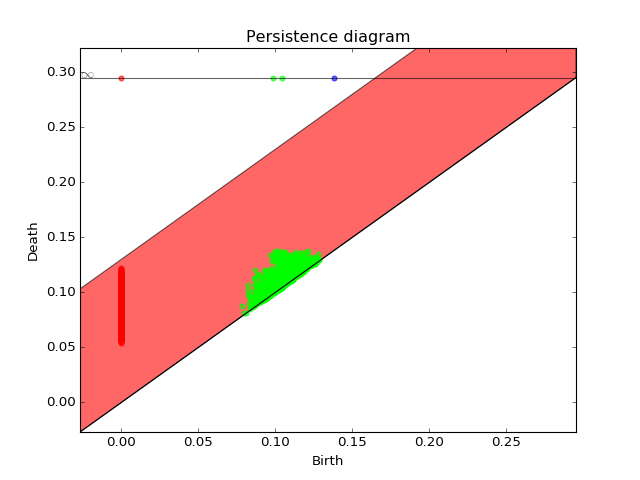
Show persistence as a diagram
This function can display the persistence result as a diagram:
import gudhi

rips_complex = gudhi.RipsComplex(off_file=gudhi.__root_source_dir__ + \
    '/data/points/tore3D_1307.off', max_edge_length=0.2)
simplex_tree = rips_complex.create_simplex_tree(max_dimension=3)
diag = simplex_tree.persistence()
plt = gudhi.plot_persistence_diagram(diag, band_boot=0.13)
plt.show()